Flikr Photostream

Created with flickr badge.

Friday, October 11, 2013

NASCO : North American Strategy for Competitiveness


The North American Strategy for Competitiveness (NASCO) is a fascinating organization. The economic trading partnership represents nearly a quarter of the global Gross Domestic Product (GDP). We are blessed with strong connections in terms of land, people, culture, and economy. This was my first time as the newly minted President and CEO of Port Alberta attending the NASCO 2013 conference in the Great State of Texas. I pushed a number of things off my plate to meet with industry and government leaders from across Canada, the United States, and Mexico in San Antonio.

My thoughts quickly drifted back to a time when I lived only 25 minutes from the Mexican border in Arizona when my home was in the Sonoran desert. We all shared the same desert, the same weather, the same food, and the same culture. There was an international border, but it wasn't difficult for us as we could drive to "la Frontera", grab a parking spot, and just walk across the line. For us, it was like walking across the street. Not much changed except for the number and type of stores set up at the border for the tourists. 

I knew there would be plenty of Mexicans at the conference and looked forward to meeting them and speaking Spanish.  One of the first orders of business was to register for the conference.  While looking for the registration desk, I was greeted by very nice people from Mexico speaking Spanish.  We immediately engaged in conversation and a lady from the State of Michigan joined the group. I grew up near the Windsor/Detroit border, so we had a lot to talk about.  Having spent most of my life 15 minutes from the Canadian/US border or the Mexican/US border, I was in my element.

As we continued to chat, I was graciously escorted into a room with a couple dozen people. We all exchanged business cards and I noticed these people represented their respective governments at a pretty high level. After a quick reference to the event schedule on my iPhone, I realized the seat I occupied was for "invited only" government leaders for the NAFTA countries!  Inadvertently, I wound up at the meeting of ministers.

I thought to myself, “maybe this is meant to be”, after all, I have the heart of a Latino and citizenship of Canada and the United States.  My participation and opinions were welcome in the discussion on how the three NAFTA countries might best move forward on a variety of levels. It was a thrill to observe and collaborate with such brilliant international thought leaders instrumental to the fate of the NAFTA region.

Canada, the United States, and Mexico account for nearly a quarter of the global GDP.  That fact, in and of itself, is staggering.  The United States imports nearly twice as much oil from Canada as Saudi Arabia.  Canada has invested over $230 billion in NAFTA partners and our trading relationship has blossomed to over a trillion dollars.  The combined GDP of Canada, the United States, and Mexico were about $19.2 trillion last year.  The Government of Canada has been keenly aware of a shifting multi-polar world and what that means for Canadian trading and competitiveness.  

Mexican reforms seem to be gathering momentum as indicated by considerable capital starting to pivot from Latin American markets into Mexico.  Initial Public Offerings (IPOs) and add-ons seem to be shifting capital from Brazil toward Mexico. Over 10 billion in IPOs have been racked up this year to date. While the Asian IPOs have retracted, North American IPO proceeds have gained.  Mexican President Enrique Peña Nieto is considering changes to the Constitution of Mexico, in particular, articles 25, 27, and 28 of the Constitution. 

President Enrique Peña Nieto
The potential reforms in Mexico would radically change the Mexican economy and shift foreign investment back into high gear.  It is thought that Petróleos Mexicanos (PEMEX), the state-run oil company, could ramp up exploration in dwindling oil fields.  But the alteration of the Mexican Constitution requires a 2/3 vote, and it is unlikely to pass unless President Nieto's PRI party can secure the support of the conservative PAN party which is not entirely opposed to the idea, but in order to secure their support, they are asking to have electoral reform which would allow a run-off between first and second place candidates in Presidential elections according to Jose Maria Martinez, deputy leader of the PAN in the Senate.  

Over 11,000 trucks move across the border crossing between Laredo, Texas, and Nuevo Laredo, Tamaulipas every day.  If you're going to cross the US/Mexican/Canadian border, here's a handy link for real-time data that shows the best time to cross for passengers and commercials.  Between Canada and the United States, over 1.4 million worth of goods and services cross the border from the United States every minute of every day. That's a $710 billion dollar market between the U.S. and Canada alone.  It's no wonder the Government of Canada is going to build a new bridge across the Detroit river because it is Canada's largest trade corridor with over 25% of U.S. and Canadian trade.

New Bridge from Windsor to Detroit - designed by Ted Zoli
Canada will pick up the tab for the construction of the bridge at several billion dollars (estimated between 3 and 4 billion).  That bridge represents what every person from the Detroit / Windsor corridor knows... the trading relationship sends more value in cargo across the Detroit river every day than we trade with many countries all year long.  In short, it's the single largest trading corridor in North America and it's growing.

The bridge in Laredo is also tremendously important too.  The Laredo bridge is called the World Trade International Bridge, and it carries about 10,000 (or more) trucks a day delivering cargo between the United States and Mexico. This Laredo bridge spans the Rio Grande. You can check out the bridge cams at this link.

World Trade International Bridge - Laredo

When people start talking about NAFTA, I have a whole new perspective on just how important it is for our three countries.  NAFTA matters and the key relationships we have with Mexico, Canada, and the United States are incredibly important to our economies and to our people.  Suffice it to say, I've always believed in free trade and I've always felt the relationship between Mexico, Canada, and the United States is enormously important.  Between the three countries, we can claim continental energy independence.  There are many reasons why the trading relationships of NAFTA are critical to all three countries, but the sheer size and velocity of goods and services are simply unmatched anywhere else.

Mexico, the United States, and Canada represent about a quarter of the World's GDP, over 14 million jobs depend on this relationship, and it is a 19 trillion dollar market, larger than the European Union and twice the size of China.  The message I gave the meeting of the leaders was very simple. The problems for the supply chain and logistics between Mexico, the United States, and Canada began on one particular date, September 11, 2001 a.k.a. 9/11.  That's when the borders started to become difficult to negotiate.  Only I was able to say that in no uncertain terms. Everybody else had to be restrained in their choice of words because they were high-level political representatives... I was the guy representing the industry and was not bound to the same requirement to dance around the heart of the issue.  Naturally, I put it right out there on the table and I think very much to the relief of the government officials present.

We must leverage our advantages as technological leaders and thought leaders to make make our borders easier to cross for our trade, and we can do it by leveraging technology for more intelligent border systems, cooperating more closely on these matters, and focusing on our ability to leverage these things while approving energy infrastructure, like Keystone, to create a strong energy security policy that benefits all three nations.  These recommendations, in a slightly different form, were put forth on my birthday, October 3rd, from the Canadian Council of Chief Executives and addressed to President Obama, President Nieto, and Prime Minister Harper.  

I believe President Nieto is leading a visionary change that will bring increased prosperity to Mexico.  The Eagle Ford shale play extends into Mexico and there is so much more.  But PEMEX will require the kind of expertise Canadian and U.S. companies can bring to the table in order to unleash the enormous potential of Mexican natural resources.  The United States must also consider the importance of completing the Keystone project, which in and of itself does not create a complete solution to the breadth of North American energy security that all of us want, but it will certainly help.  And to be clear, the majority of U.S. citizens want Keystone to move forward.


We recognize that business leaders and the United States Congress join the majority of the people in their desire to see Keystone move forward.  North American energy independence allows us to apply our own technologies and innovation in our marketplace instead of pushing global energy production into the hands of nations where environmental controls are nowhere near our environmental control standards.  Democratic stability and decades of harmonious relations across the NAFTA countries support continued policy development that will benefit North America.

President Nieto and President Obama


President Nieto and Prime Minister Harper
If we apply our technologies and make a genuine attempt to work more closely to harmonize our security and enhance the flow of goods and services across the North American supply chain, we will advance our economies and move forward together.


Monday, July 15, 2013

The Siberian Methane Burp

Eastern Siberian Arctic Shelf Carbon Deposits of methane and carboniferous materials on Arctic coastal areas also represent a considerable store of materials that have potential to release greenhouse gas emissions that will continue to accelerate the rate of climate change.  The Eastern Siberian Arctic Shelf (ESAS) covers approximately 7,000 kilometers with significant outcroppings of complex ancient ice deposits rich in carboniferous materials in addition to substantial quantities of shallow sub sea permafrost.  This exists throughout the entire Arctic region, but the ESAS is by far the most proliferous area.


As climate change creates larger open water areas in the Arctic for longer periods of time, erosion of these shelves increases the release of these carboniferous materials into the ocean.  Microbial consumption of these materials produces carbon dioxide and methane.  The release of carbon dioxide and methane vent to the atmosphere.  Massive deposits of methane hydrates are also known to exist in the form of methane hydrates trapped in a frozen state beneath the Arctic tundra. Coastal erosion due to increased tidal activity combined with warming will bring these coastline and sea-based deposits into the mix.  Since methane has approximately 20-23 times greater impact on warming, meaning it traps much more heat, the ramifications of large-scale emissions of methane into the atmosphere further exacerbate the positive feedback loop effect.  

Because methane dissipates relatively quickly, the overall impact of methane release may not have an enormous impact on overall global average temperatures in and of itself, taken together with other components in a planetary scale positive feedback loop, the impact could be magnified significantly. If the technology existed to easily capture methane from the Arctic tundra, the sheer quantity of deposits might help to accelerate the economic viability of methane production.  Because methane is a very efficient fuel, there is little doubt that an economic model to capture methane would be of serious interest to various stakeholders in the Arctic, especially those who would be in a position to benefit from profitable resource development. 


Capturing the methane before it escapes into the atmosphere would prevent a greenhouse gas some 20+ times more potent than CO2 from contributing its effects to climate change.  But the numerous challenges of getting to the resource and then fielding the technology to capture it present challenges that may render this option uneconomic.  Nevertheless, it's something we continue to ponder and think about... after all, if we're not paying attention to it, we might find out one day we were ignoring a vast source of greenhouse gas.


Could methane be a tipping point greenhouse gas that forces extraordinarily expensive adaptation strategies to be implemented at a greatly accelerated pace?  If it does become a tipping point gas, it's safe to bet it could impact climate change faster than most policy analysts would ever be willing to publicly admit.

Wednesday, June 5, 2013

Arctic Climate Change : The Big Melt


2012 Arctic Sea Ice Minimum
Climate change in the Arctic happens faster than anywhere on the planet, a scientific fact that finds little dispute from any interest group.  For many years, it has been described as the canary in the coal mine (Michaels, 2004).  As circumpolar leaders and experts met at the Arctic Imperative Summit in the Summer of 2012, the recession of Arctic ice, a.k.a. the ice melt, had exceeded 2007 levels (NSIDC, 2012), the previous record Arctic sea ice area recorded since 1979.

While the Arctic shows evidence of global climate change at a faster rate than other areas, it would present a very attractive subject for research and study.  There is room to expand the interdisciplinary aspect of the many scientific fields studying climate change impacts in the high Arctic, but this is offset by the difficulty and expense of reaching Arctic areas and then conducting research (Hinzmon, 2005).


The challenges are real, the Arctic is changing quickly, and projections of increased economic activity in the Circumpolar World are inevitable.  Recognition of the consequences of accelerating climate change for Arctic environments will aid the voices advocating for more research funding on the part of the Circumpolar World.


Swedish researchers note a generalized loss of cold winters and cool summers while noting more extreme precipitation events.  Their understanding of the rate of climate change has led them to focus on adaptation strategy.  Like many entities, the circumpolar governments and regional stakeholders are turning more and more energy to the adaptation process (Callaghan, et al., 2010).  In the eyes of all the circumpolar nations, the debate as to if the climate is changing is long gone.  The conversation is now about how best to adapt since their part of the planet will be impacted fastest.

Reduction of Arctic Ice

The reduction of Arctic Ice creates a variety of issues and opportunities.  The issue from the standpoint of ice melting is that polar ice reflects light (and heat).  As the ice melts, the dark water surface absorbs more heat, which creates a faster temperature rise which, in turn, causes the ice melt to occur at a faster rate.  This kind of feedback system, referred to as a positive feedback loop, is one of many components that impact global climate change. Water on top of the ice pack also creates more rapid heat absorption because it creates a dark area on the ice surface, absorbing more heat.  While melting Arctic ice does not cause sea levels to rise, much like a melting ice cube in a glass of water does not cause the level of liquid in the glass to rise; it does create warmer temperatures which cause other circumpolar ice to melt.  As large amounts of land-based ice melt, like the Greenland Ice Shelf, that does introduce more water into the ocean, which does raise the sea level. 

As Arctic ice minimums continue to advance, creating more dark water, the ramifications impact not only the acceleration of temperature change, but it also creates young ice areas which require less energy to melt.  The National Snow and Ice Data Center track daily changes in the Arctic ice cover.  The Arctic ice recedes yearly and melts during the warm months, typically stopping its recession around the end of September when it becomes cold enough for the ice coverage to begin extending again.  In 2012, the Arctic ice minimum was found to be at the lowest levels since this data has been tracked by satellite (NSIDC, 2012).

The Greenland Ice Sheet

The Greenland Ice Sheet is a massive land-based circumpolar ice deposit.  This vast area of ice is starting to undergo rapid melting cycles.  While this has been noted by scientists for many years, the rapid acceleration of Greenland’s ice combined with additional complicating factors, is only recently emerging as an environmental issue that is starting to command global interest.

Unusual weather patterns noted in 2012 include the U.S. drought, and a sudden widespread surface melt event impacting the Greenland Ice Sheet.  This set of circumstances, known as a heat dome, occurs when the jet stream patterns keep cooler air to the north which, in turn, allows warmer air from the Gulf stream to rise up to Greenland.  The phenomena this year, in July, caused a rapid spread of surface melt in Greenland, extending the area from about 40% of Greenland’s surface to nearly complete coverage over the course of four days.

Typically, the maximum surface melt area in Greenland during the hottest point of the summer is around 50%.  The scope of these phenomena is certainly attention-getting but there is also evidence this may be part of a cyclical event.  While there is not enough evidence to suggest this predicts an impending catastrophic ice loss and resultant accelerated rates of sea level rise, it certainly warrants further investigation and attention.

If instability and accelerating melting takes place on the Greenland Ice Sheet and the Antarctic, the level of sea rise could be far faster than was originally thought.  It seems like scientists continue to be surprised each year as the rate of change exceeds the predictive components of their models.

If there is a tipping point and the largest of the land-based glaciers melt into the ocean, we would have sea levels that are several meters higher than they are now.  Under the most prepared scenario, it is hard to imagine to what extent such an incident would damage global trading patterns and to what extent that would impact weather.


Greenland Ice Sheet Melt July 2012

Satellite Data from NASA’s Gravity Recovery and Climate Experiment satellite was taken between 2002 and 2008; demonstrating that Greenland has been losing approximately 195 cubic kilometers of ice per year.  A large section of the Pederson glacier, some 130 square kilometers, broke off due to the high temperatures, but since this section was already floating on the ocean, it will not contribute to rising sea levels.  That said, as similar weather patterns repeat in conjunction with rising average air temperatures, the rate of melt on land is likely to grow. 

Pederson Glacier Ice Melt

Ice melt rate is also affected by other factors, including airborne particulates raining out over the ice sheet causing dark spots.  Images of these dark spots evoke an interest in knowing if they are hydrologically isolated from sub-surface water.  The dark holes appear to be boreholes.  These holes initially absorb solar energy at a higher rate causing an increase in the rate of melt in the holes.

Black Holes on Greenland Ice Shelf
As the holes get deeper, the rate of deepening begins to rescind as the exposure angle to the sun decreases, and at some point, the rate of melt equalizes with surrounding ice.  As these holes create a matrix of higher melt points, they become subject to interrelationships with under-surface fissures and fractures of the major ice sheets.  To the extent these may drain into large ice sheet fractures, the rate of progression to land-based ice and land contact points tends to create an opportunity for ice to shift and move, probably a lot sooner than it otherwise would have.

Particulates that absorb heat like black carbon, vanillic acid, and sulfur that fall on the Greenland ice shelf create the aforementioned dark areas creating boreholes that melt faster than the surrounding reflective white ice.  This functions like drilling holes in the ice sheet which facilitates gravity-dependent water flow migration towards the bottom of the sheet, creating subsurface conditions that encourage a more rapid rate of ice migration towards the sea.

Particulate-driven cryoconite holes that look like boreholes have also been widely reported by glaciologists, especially those who study the Greenland ice shelf.  It is thought, based on the chemical composition of the soot that much of it comes from coal-burning plants in Asia; this is based on assumptions of wind conditions and observable fallout patterns.

Rivers of water are also noted with massive drop-offs into large crevasse structures.  It’s the combination of rising surface temperatures, and particulate fallout from high-emission industrial output that creates what appears to be a causing accelerated migration of surface water to the ice bedrock interface (Zwally, et al., 2002).  It may also be presumed these holes contribute integrity challenges to the ice sheet, probably creating larger areas that break off as the ice sheet approaches the ocean.  Other chemical compositions suggest some of the soot is due to massive forest fires in other parts of the globe, another by-product of climate change as large forested areas undergo significant drought during the summer months, hence creating ideal conditions for large forest fires.

Ice core samples reveal coal soot particulate content in the Arctic can be correlated to the maximum effect of the industrialization of the period from 1906 to 1910 (McConnell, 2007) and note thermal temperature rises eight times larger than pre-industrialization.  Much of that, by the way, is thought to have derived from the United States and Canada.

Ice Core Samples

Ice core samples, through trapped air pockets, can be analyzed to reveal carbon dioxide in the atmosphere during previous eras.  There is ample evidence that CO2 levels in the atmosphere correlate with average mean surface temperatures due to the heat-trapping ability of the material in the Earth’s atmosphere.  The projections of CO2 emissions through the remainder of the 21st century are substantial.  Even with efforts to mitigate emissions, the ramifications imply increased temperatures which mean the planet will continue to shed ice.

Ice Core CO2 Analysis & Predictions

Eastern Siberian Arctic Shelf Carbon Deposits and Methane

Eastern Siberian Arctic Shelf Carbon Deposits of Methane and carboniferous materials on Arctic coastal areas also represent a considerable store of materials that have the potential to release greenhouse gas emissions that will accelerate the rate of climate change.  The Eastern Siberian Arctic Shelf (ESAS) covers approximately 7,000 kilometers with significant outcroppings of complex ancient ice deposits rich in carboniferous materials in addition to shallow sub-sea permafrost.  This exists throughout the entire Arctic region to some extent, but the ESAS is by far the most proliferous.

Eastern Siberian Arctic Shelf
As climate change creates larger open water areas in the Arctic for longer periods of time, erosion of these shelves increases releasing carboniferous materials into the ocean.  Microbial consumption of these materials produces carbon dioxide and methane.  The release of carbon dioxide and methane vent to the atmosphere.  Massive deposits of methane hydrates are also known to exist in the form of methane hydrates in a frozen state trapped beneath the Arctic tundra.

Coastal erosion due to increased tidal activity combined with warming will bring these coastline and seafloor deposits into the mix.  Since methane has approximately 20-23 times greater impact on warming, meaning it traps much more heat, the ramifications of large-scale emissions of methane into the atmosphere further exacerbate the positive feedback loop.  Because methane dissipates relatively quickly, the overall impact of methane release may not have an enormous impact on overall global average temperatures (Kvenvolden, 1988) in and of itself, taken together with other components of a positive feedback loop, the impact could be magnified.

If the technology existed to easily capture methane from the Arctic tundra, the sheer quantity of deposits might help to accelerate the economic viability of methane production.  Because it is a very efficient fuel, there is little doubt that an economic model to capture methane would be of serious interest to the Arctic and to stakeholders in the Arctic, especially those who would be in a position to benefit from resource development. 

Capturing the methane before it escapes into the atmosphere would prevent a GHG some 20+ times as potent as CO2 from contributing to climate change, but the climate ramifications of getting to the resource and how it would be combusted would still have an impact, so it would be at a net cost to the environment, but that net would be somewhat less than simple emission.

Works Cited

Michaels, P., 2004. The Economist; A canary in the coal mine. [Online] 
Available at: http://www.economist.com/node/3375415
[Accessed 19 01 2013]
NSIDC, 2012. Arctic Sea Ice News and Analysis. [Online] 
Available at: http://nsidc.org/arcticseaicenews/
[Accessed 02 09 2012]
Hinzmon, L. D., 2005. Evidence and Implications of Recent Climate Change in Northern Alaska and Other Arctic Regions. [Online] 
Available at: http://link.springer.com/article/10.1007%2Fs10584-005-5352-2?LI=true
[Accessed 28 12 2012]
Callaghan, T. V. et al., 2010. A new climate era in the sub-Arctic: Accelerating climate changes and multiple impacts. Geophysical Research Letters, 37(14)
Zwally, H. J. et al., 2002. Surface Melt-Induced Acceleration of Greenland Ice-Sheet Flow. Science, pp. 218-222
McConnell, J. R. e. a., 2007. 20th-Century Industrial Black Carbon Emissions Altered Arctic Climate Forcing. Science, 317(7 September 2007), pp. 1381-1384
Kvenvolden, K. A., 1988. Methane hydrate — A major reservoir of carbon in the shallow geosphere?. Chemical Geology, 71(1-3), pp. 41-51

Leadership by the numbers : a compilation of CF best practices modified for corporate application

Duty is about what we do, a leader’s duty is to serve the mission.  Honour is about how we perform our duty.  Leaders must perform their duties in accordance with the civic, legal, and ethical values embraced by our society.  . Effective leaders get the job done, look after their people, think and act in terms of the larger team, anticipate and adapt to change, and exemplify our ethos in all they do.  This is what the organization expects and it is also what the people whom we serve expect.  Altogether too often, the public is sad to learn their leaders have not lived up to an ethos of high standards.  Part of our ethos, then, should be to say that we will stand up to be moral, effective, and genuine leaders.  For it is only through a strong commitment to an ethos our people can be proud of, that we will be able to provide the characteristics of strong and capable leaders and give the people what they so rightfully expect.

~ General Rick Hillier – Chief of Defence Staff

(Taken in part and editorialized by the author)

CF Modified Effectiveness Framework

Effectiveness Framework


Emanation Paths

Emanation paths represent secondary outcomes of the Effectiveness Framework, each of which has a positive bi-directional connotation for enhanced team growth and increased probability of success.

Organizational Success

The collective planning and action of an organization with operations that span different trades, departments, crafts, and various necessary functions is paramount.  It is necessary to perform the thousands of myriad tasks that take place to keep the organization functioning smoothly.  Typically, if we are engaging correctly and moving forward as a team, the team success will be there as a result of the collective planning and the actions of an organization.

Internal Integration

The internal operations of the organization must be well organized, the functions clear, and the reporting of agreed upon metrics must be established.  The achievement of teamwork and cohesion among the people must fit together in order to work together effectively.

Member Well Being and Commitment

Respect, care, and consideration are fundamental qualities.  By engaging others with respect and acting to support their professional hopes, goals, and aspirations we show a sincere commitment from the organization toward the people.  This is a moral obligation that also happens to be highly practical.

Conduct (ethos)

Conduct or ethos encompasses values that describe and define organizational conduct.  This behavioral dimension includes the civic values of liberal democracy; values subsumed by the rule of law; ethical values governing our treatment of others and the conduct of government operations; and the traditional values of duty, loyalty, integrity, and courage.  The ethos is the essence of your honor.

The Importance of Trust

Trust in leadership is positively related to individual and group performance, persistence in the face of adversity, the ability to withstand stress, job satisfaction, and commitment to continued service.  One of the most important parts of the leader’s job is to build and maintain healthy trust relationships with subordinates, peers, and superiors. Leaders build and maintain trust through their decisions, actions, and interactions.

Leaders build and maintain trust through their decisions, actions, and interactions.  Leadership qualities exhibited by each leader of the organization is reflected onto every other leader within the organization.  As such it follows that the leaders should, at a minimum, always exhibit these traits:
  
  • Demonstrate high levels of proficiency in the performance of core functions and take advantage of opportunities to enhance professional expertise and competence
  • Exercise good judgment in decisions that affect others and do not expose people to unnecessary physical or emotional risks
  • Show trust and confidence in team members by giving them additional authority and involving them in decisions where circumstances allow
  • Demonstrate concern for the well-being of team members, represent their interests, and ensure they are supported and taken care of by the organization
  • Show consideration and respect for others, treating teammates fairly, without favor or discrimination
  • Focus on the mission, maintaining high standards as well as honest and open communications
  • Lead by example, sharing risks and hardships and refusing to accept or take special privileges
  • Keep your word and be counted on to honor your obligations

Distributed Leadership

Distributed leadership is about sharing the responsibilities of leadership, vertically and horizontally within teams and the organization as a whole.  Leadership is an essential role requirement for managers but is not the same thing as management.
  
Leaders are involved in planning, problem-solving, decision making, organizing, informing, directing, allocating and managing resources while developing, coordinating, monitoring, and controlling the course of those efforts.  The expectation is simple; leaders will not only lead but that they will lead well.  They will always seek to develop the team around them; they will never seek to be the smartest person in the room, but rather, they will surround themselves with other strengths and leverage those strengths, constantly seeking ways to share the leadership role through a distributed environment based upon a foundation of trust.

Professional

A profession is essentially an exclusive group of people performing a service to society and unified by a common body of expertise and code of conduct.  The words of a professional cannot be just words on paper or empty commitments, they must be publicly visible consistent patterns of behavior. Leaders make the difference.

Leaders Primary Responsibilities


·         Build Teamwork and Cohesion
·         Professional Competence and Self-Improvement
·         Clarify Objectives and Intent
·         Solve Problems with Timely Decisions
·         Mentor, Educate, and Develop Team Members
·         Treat Team Members Fairly
·         Respond to Their Concerns
·         Represent Team Members' Interests
·         Maintain Situational Awareness
·         Learn From Those Who Have Experience
·         Learn From Experience
·         Exemplify the Ethos

Member Well-being and Commitment

The primary leader roles pertaining to the member well-being and commitment dimension of effectiveness are those of sustainer and developer. In the sustainer role, the leadership team is responsible for establishing a healthy organizational climate, treating people fairly, and managing interpersonal conflict.  The leader must also sustain the individual and collective interests of their people and seek to build morale wherever possible.
  
In the developer role, leaders foster and recognize achievement, and protect depth and continuity in teams by cultivating potential replacement leaders. They mentor people in apprenticeship positions and challenging assignments, and encourage and support subordinate participation in training, educational, and professional activities over their career span.

Enhance Situational Awareness – Explain Events and Decisions

The routine and prompt passage of information contributes to teammates’ situational awareness and their ability to respond appropriately to a changing situation.  Situational awareness is critical to anticipating future environmental conditions and identify opportunities to secure organizational advantage.  Candidly explaining events and decisions often reduces tensions created by uncertainty and is critical to maintaining the trust relationship between leaders and led.

Collective Leadership

Collective leadership refers to the combined effects and synergies when leaders at different levels synchronize their leadership actions to achieve a common purpose.  High performing collective leadership occurs when leadership processes are mutually reinforcing; the result is greater than the sum of its parts.  Leveraging collective intelligence to establish collective leadership shifts fine organizations into high performing organizations with stellar performers.

Friday, May 10, 2013

Devon Lions Campground

Preserving the Park

In the last few years, according to the Devon Lions and the Lions Campground Management, it is estimated that 6 to 8 feet of shoreline has been lost, in particular, in the area adjacent to the Campground office.  This, however, has never been actively marked nor measured for the purposes of quantification.  

Empirically, we are left with areal analysis to approximate rates of erosion.  Locals also point out the dogleg area of the roadway, being in greatest proximity to the river bank, as having significant potential for negative operational impact to the Devon Lions Campground.  This is the area widely considered to be of critical importance.


This area presents a significant concern due to the potential for interruption of traffic flows and normal operations of the campground.  An approximation of distance from top of bank to nearest roadway construction at the time of this photo was approximately 6.1 meters (approximately 19.7 feet), it has likely degenerated to a modest degree since the time of this areal image.  A foot inspection with GPS coordinate capture will establish baseline data starting in 2013.

Given the low average of erosion over the last two years (in accordance with local knowledge), the timeline for the expected impact of operations, all else equal, would be some years away.  Using the 4-year longitudinal average at a rate of .7025 feet per year, the declination would be calculated as: (19.7 / .7025 = 28).  Enhanced flow level years, when overtopping occurred, are not believed to be included in the four-year comparison.  In general, it's safe to say the dogleg road area isn't likely to wash out this year or even next year, even when adjusting for shoulder easement and safe foot travel area.

Erosion accelerates by a combination of volume and rate of the flow in the river.  In other words, the amount of water and how fast it flows has a powerful impact on the erosion rate.  Overtopping the bank, i.e. "the big flood", is a rare event and unlikely to cause substantial damage due to the overtopping itself.  Instead, it is the power of the river and the rate of river flow sustained during overtopping events that would have the most powerful impact on erosion.  This, of course, is why precipitation levels and dam release are central to a root cause analysis. 

Extraordinary flooding circumstances create some amount of erosion.  Project engineers from both commissioned firms, Peregrine and EBA, agreed when asked directly, that it is the quantity of water and the flow rate of the water, as controlled by dam release, that has, by far, the most considerable impact.

Geotechnical analysis should be focused on the area near the cabin, the dogleg, and the area with the minimum extent of bank coverage.  These were the sentiments agreed upon by the Lions in conjunction with the meeting of the Town of Devon representatives.  Upriver conditions were examined; visual inspections did not report visible tension cracks.  EBA states there is no risk of imminent riverbank failure.  The main roadway in the campground could be compromised to traffic well before the riverbank erodes to the point of contact. 

Most erosion occurs during the major water release periods from upriver dams.  This may happen in conjunction with heavy precipitation events or during times of high snowmelt and glacial melt.  Environment Canada records show the majority of precipitation is recorded from May through September.  Spring melt combined with substantial precipitation events probably carries the highest potential for overtopping.  The Peregrine consultant corroborated this information during her immediate post-inspection visit and site de-brief.


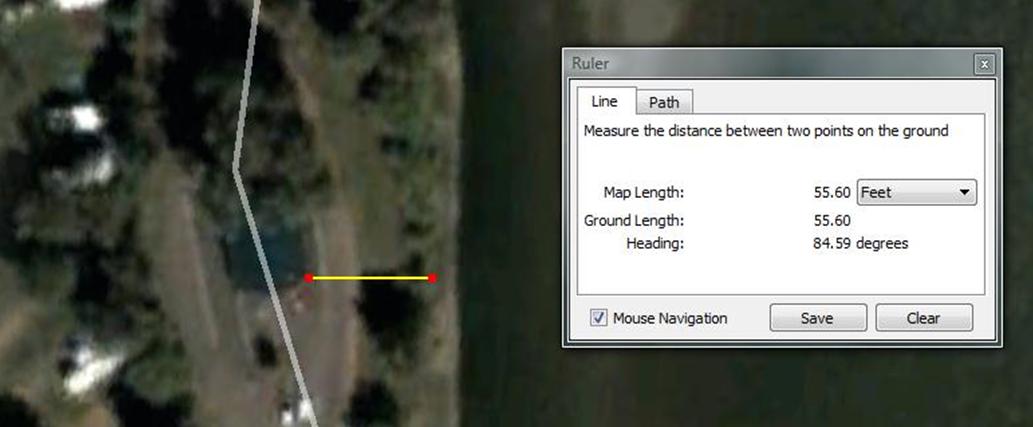
Google Earth shots available to the public were used for riverbank erosion "rough" analysis.  Two data points by Google Earth applicable to this area were drawn from 2004 and 2008 data.  A line was drawn from the bottom (SE corner of the Cabin directly to the riverbank at approx. 85.xx degrees < 1-degree variance and compared between the years 2004 and 2008.  The year 2004 shows approximately 59.23 feet and the 2008 image shows approximately 55.6 feet.  The rate of declination over the four-year period approximated at 3.63 feet. 


A second analysis was done using a fixed infrastructure point.  In this case, the measurement was centered on a fixed point and extended to the top of the bank as imaged overhead.  The reduction of terrain appears to be approximately 2.81 feet in this case.  The rate of bank erosion varies from area to area.  Compensation was applied for a < 1-degree variance, generally compensated by selecting an anchor point in line with extended vegetation and a clear demarcation of bank shading, indicating the exposed face of the riverbank. 

Again, heading variance accounts for a minor distance variance, probably less than a couple of inches.  This measurement is subjective on the riverside anchor point due to vegetation changes and interruption of overhead resolution of the image, yet it is probably a fair indicator.  Close examination also reveals lost vegetation, although the major trees appear to remain intact.  This could be the result of pruning or the result of smaller vegetative features eroding into the river.  It is impossible to detect this with low-resolution satellite imagery and the measurement should only be considered a very rough estimate.


It seems unlikely that erosion rates would be consistent along the course of the area under study, and the predominant hydrological factor affecting the rate would probably be the evident sand bar that exists in the river proximal to the area of the cabin.  Intuitively, it appears to have the effect of slowing the rate in that area.  As the river flow rate slows, sediment tends to fall out or "sink" which would create and sustain a feature like this sandbar. 

As the river passes that zone and proceeds down the river, it seems to pick up speed, thus predictive of a more rapid rate of recession in the downriver area.  This presumptive estimate seems to have been borne out by measurements.  The EBA study focused on the same area provides no analysis as to the rate of declination of the land area.  Their overhead imagery is the same source (Google Earth) with imagery taken from the 2008 posting of Google Earth.  The EBA study had no year-over-year comparisons or period-over-period analysis.  Although the bottom right corner of the image shows "2012", this refers to the access year of the image by the Google Earth user.


The third area of analysis was set on the distal area of the driving road anchored in the central traffic division feature that existed at both points in time.  The 2004 image shows approximately 87.96 feet compared to the 2008 image at 81.71 feet, or approximately 5.25 feet of recession.  Once again, the downriver portion of the river study area appears to be showing a gain in velocity.  In Saskatoon, a confluence near an erosion riverbank area seemed quite similar to Washout Creek and suggested potential interplay with erosion rates near the confluence with the North Saskatchewan, potentially introducing another hydrological feature into the mix that could create increased bank instability, which, as noted above, has been an ongoing issue in the Saskatoon region.


The Bighorn dam created Lake Abraham, Alberta's largest man-made lake.  The Bighorn Plant generates enough electricity to supply the equivalent of 58,300 Alberta households.  The Bighorn embankment dam was built in 1972 in the mountain gap at Windy Point, in the Front Ranges of the Canadian Rockies, west of the confluence of the North Saskatchewan River and the Bighorn River, and is managed by TransAlta.

The Brazeau Dam is located in Brazeau County of Central Alberta, 55 kilometers (34 mi) southwest of  Drayton Valley.  It was developed along the Brazeau River, at the confluence with Elk River, in the hydrographic basin of the North Saskatchewan River.  The Brazeau Dam is managed by TransAlta and produces 394,000 MWh per year, with a capacity of 355 megawatts. 

Since release from the Bighorn and Brazeau are, in times of large precipitation, largely interdependent,  the impact of water level and velocity are directly influenced by these two dams.  There are many factors that govern water release.  The upriver dams would both have a considerable impact on flow rate and quantity.

The North Saskatchewan River is subject to the 1969 Prairie Provinces Water Board Master Agreement on Apportionment (PPWB), which states that Alberta must allow 50% of the natural flow of east-flowing rivers to enter Saskatchewan.  It also prescribes the minimum flow required and water quality objectives (Alliance).  It is likely to release rates would be managed, in part, by the PPWB master agreement.

The EBA project engineer who previously worked on the Shaw Conference Centre armoring, and a City of Edmonton official, both indicated there has been no effective way to generate release agreements designed to mitigate erosion between hydroelectric operators and individual municipalities.  It seems unlikely Devon would fare any better.  In addition to the requirements of the PPWB Master Agreement, there are commercial considerations for power generation.  

Erosion appears blunted near the cabin due to the projection of the pronounced sandbar.  This is evidenced in the 04-08 erosion rate of 3.63 feet.  The natural velocity of the river should tend to be slow immediately proximal to the downriver side of the sandbar projection and then accelerate as it progresses past the cabin area.  This, in turn, should present by way of further erosion rates on downriver trend as is borne out by the 2004-2008 findings that show a similar rate of erosion at the dogleg of 2.81.  Cabin and dogleg measurements are similar for rates of erosion. 

The river apparently begins to pick up speed at the third measurement point, advancing to a rate of 5.25 feet over the same period of time.  These measurements can be precisely calculated via surface GPS release floats, undercurrent speeds may also be calculated in a similar manner.  The findings corroborate intrinsic knowledge and logical inference.  Some flow rate and river level historical records may be consulted to examine concerns of overtopping due to severe floods.  Some photographs of overtopping events have been brought forward by local residents.

There are unknown hydrological implications of the washout creek confluence and the interplay of aquifer recharge upstream of the confluence.  Recharge influence over lateral instability could logically result in an alluvial presentation of erosion proximal to the confluence.  Local knowledge suggests there may exist one overflow pipe system for confluence drainage, probably designed for overtopping mitigation of Washout Creek.  Documenting and evaluating this drainage system may turn out to be an activity with merit.

The City of Saskatoon has battled riverbank erosion since the early part of the 20th century.  Numerous studies have been commissioned along with a variety of remediation efforts.  Much of their efforts have surrounded subsurface drainage systems in combination with berming of slopes and armoring of the riverbank.  Their situation is largely influenced by the rate, flow, and discharge of urban-influenced surficial aquifers and regional aquifers (A.W. Clifton, 1980).  Saskatoon has obtained favorable results with berming and riverbank armoring. 

To my knowledge, a stratographic assessment of the Lions Campground has never been done, which precludes an understanding of aquifer recharge implications relative to stratographic identification of potential erosion or "slide" areas.   There may be some merit in considering a stratographic assessment of drift and underlying till.  An image of the stratographic assessment of the 18th Street cross-section from Saskatoon is included as a reference.


It is possible an inferred slip zone could be negotiated scientifically, but it should also be noted that an intrinsic geologic understanding of this area could rule out the need to undertake such an assessment.  Stratographic interpretation has not been discussed by EBA or Peregrine but has been a component of both the City of Saskatoon and the University of Alberta College of Engineering studies cited herein.  In other words, the one integrated science both the commissioned reports did not have.  In the event of overtopping, such an assessment would seem to be more important relative to the inland embankment upon which housing is situated. 

Natural Resources Canada produced a comprehensive geoscape of the Saskatoon area (Canada N. R.).  NRCAN research also described coarse rock berms as a contra-erosion feature leveraged for bridge protection in low-lying areas, which is in line with coarse rock berm armoring undertaken at the Shaw Conference Center.  Appropriate geological advice prior to discarding the idea of a stratographic study out of hand might be warranted, although it seems unnecessary to our goal of protecting the campground from lateral erosion of low-lying areas and preventing the loss of corresponding parkland features of the campground.


Geoscape contextualization demonstrates the integrated science approach to erosion analysis (Canada E. ).  Conducting a spatial imaging pattern recognition analysis of the river might be warranted.  This could be attained through the Government of Alberta archives for imagery and possibly accessing data from the Spatial Information Systems Laboratory (SISL) at the University of Alberta.  Academic dialogue with leading hydrological, geotechnical, geological, and geophysical resources should not be discarded out of hand when it is possible for the SISL could provide access to GIS data and mapping software at little to no cost with possible collateral interactions with multidisciplinary scientists.

One thing is certain; we are not alone.  Edmonton's river valley has also been the subject of considerable study.  In every study related to riverbank erosion that I have consulted, they have all included stratigraphic and topographic considerations of relative geology in the immediate area of concern.


Referenced is a study undertaken by the University of Alberta in conjunction with the physical expansion of the University.  The study was headed by the Dean of the College of Engineering (S. Thompson, 1978).  The conclusion of that report spoke directly to lateral erosion.  The University of Alberta, the Shaw Conference Centre, and the City of Saskatoon implemented berming and riverbank armoring.  In the case of the University of Alberta, riprap facing was employed using a variety of sizes.  The sizes were carefully selected depending on calculated erosion forces given estimated flow rates.  The University of Alberta also concluded that lateral meandering is more significant than valley downcutting.

The University of Alberta study noted the economic cost of riverbank stabilization work to be substantial.  The annual cost of riverbank stabilization approaches the value of land protected, thus they argued the only case that justifies such measures would be those instances where it would impact public use and recreational activities… as is the case in Devon.

The Town of Devon and the Devon Lions Club are two highly impacted stakeholders.  As such, the Devon Lions Club has appointed by resolution of the General Membership, two representatives to liaise between the Devon Lions Club and the Municipality.  Areas of primary concern and action items outlined by the EBA study focus on continued bank monitoring and structural engineering analysis of the existing walls and bank protection mechanisms to insure ongoing stability.  Plans are being developed to protect the campground from further bank erosion through the measure of adding "armoring" to the riverbanks.

The Town of Devon and the Devon Lions Club are two highly impacted stakeholders.  As such, the Devon Lions Club has appointed by resolution of the General Membership, two representatives to liaise between the Devon Lions Club and the Municipality.  Areas of primary concern and action items outlined by the EBA study focus on continued bank monitoring and structural engineering analysis of the existing walls and bank protection mechanisms to insure ongoing stability.  Plans are being developed to protect the campground from further bank erosion through the measure of adding "armoring" to the riverbanks.

After considerable independent research, I agree that vulnerable zones should receive armoring, although the riprap should be properly determined as per the University of Alberta study.  Given my knowledge of the beliefs of the local people, I think armoring the high-risk sites, namely, the cabin to the dogleg area would alleviate the highest concerns while protecting against the most expensive issue, the potential relocation of a roadway.  It is probably wise to explore an initial armoring phase in this area.  This would be a highly visible project providing physical reinforcement.

Riverbank armoring may not actually require approvals of other levels of government so long as the equipment used to undertake the armoring is not required to enter the river properly.  This should be investigated at the outset of any planning to prevent any possible issues with other levels of government.

Both consultants suggested low precipitation months as being optimal for work schedules.  Materials may exist by way of the Town of Devon sidewalk and curb replacement program rubble, or some form of riprap, appropriately sized and suitably esthetic.  Given the timelines, a planning phase could extend from early 2013 to late Spring 2013 or Summer, so as to accommodate public input and leverage a consultative process.  This would allow time to undertake ingress/egress arrangements to the riverbank at project commencement.  When river flow reduces in the Fall or early Winter of 2013/2014, work could be undertaken. 

Major improvements could be budgeted across fiscal years, with long-range ongoing investment through the 2014 - 2017 range if deemed feasible.  Further, a member of the Lions Club noted there was a pathway on the riverbank.  Given the River Valley Alliance (RVA) funding and the pre-existing path structures that connect the RVA, there may be some partial offsets to bank stabilization expenditures. 

There have been some discussions relative to making other changes in the River Valley.  These include an extension of the existing boat launch or possibly the addition of another boat launch.  Whatever these plans are, some amount of consideration should be given to those plans so that any work was undertaken to prevent riverbank erosion would not create undue conflicts with future projects.  

Cited 

A.W. Clifton, J. K. (1980). Riverbank instability and development control in Saskatoon. Saskatoon: 1980.

Alliance, N. S. (n.d.). About the Watershed. Retrieved November 21, 2012, from North Saskatchewan Watershed Alliance: http://www.nswa.ab.ca/content/about-the-watershed

Almanac, F. (n.d.). 2013 Long-Range Weather Forecast for Edmonton, Alberta. Retrieved November 21, 2012, from Farmers Almanac: http://www.almanac.com/weather/longrange/AB/Edmonton

Canada, E. (n.d.). Environment Canada. Retrieved 11 18, 2012, from National Hydrological Resources Centre: http://www.ec.gc.ca/scitech/default.asp?lang=En&n=44EEFEB3-1#nhrc

Canada, N. R. (n.d.). The Trouble With Valley Slopes : Landslides. Retrieved 11 28, 2012, from Natural Resources Canada Earth Sciences: http://www.nrcan.gc.ca/sites/www.nrcan.gc.ca.earth-sciences/files/pdf/sask/pdf/geoscape_southsask_landslides_e.pdf

EBA - A TERA TECH COMPANY. (2012). Riverbank Erosion and Stability Assesment North Saskatchewan River. Devon: A.F. (Tony) Ruban, M.Eng., P.Eng., Brian C. Adeney, P.Eng.

S. Thompson, D. T. (1978). River erosion and bank stabalization - North Saskatchewan River, Alberta. Edmonton: Department of Civil Engineering, University of Alberta.